
The Executive Revenue Cycle Dashboard Every CFO Needs
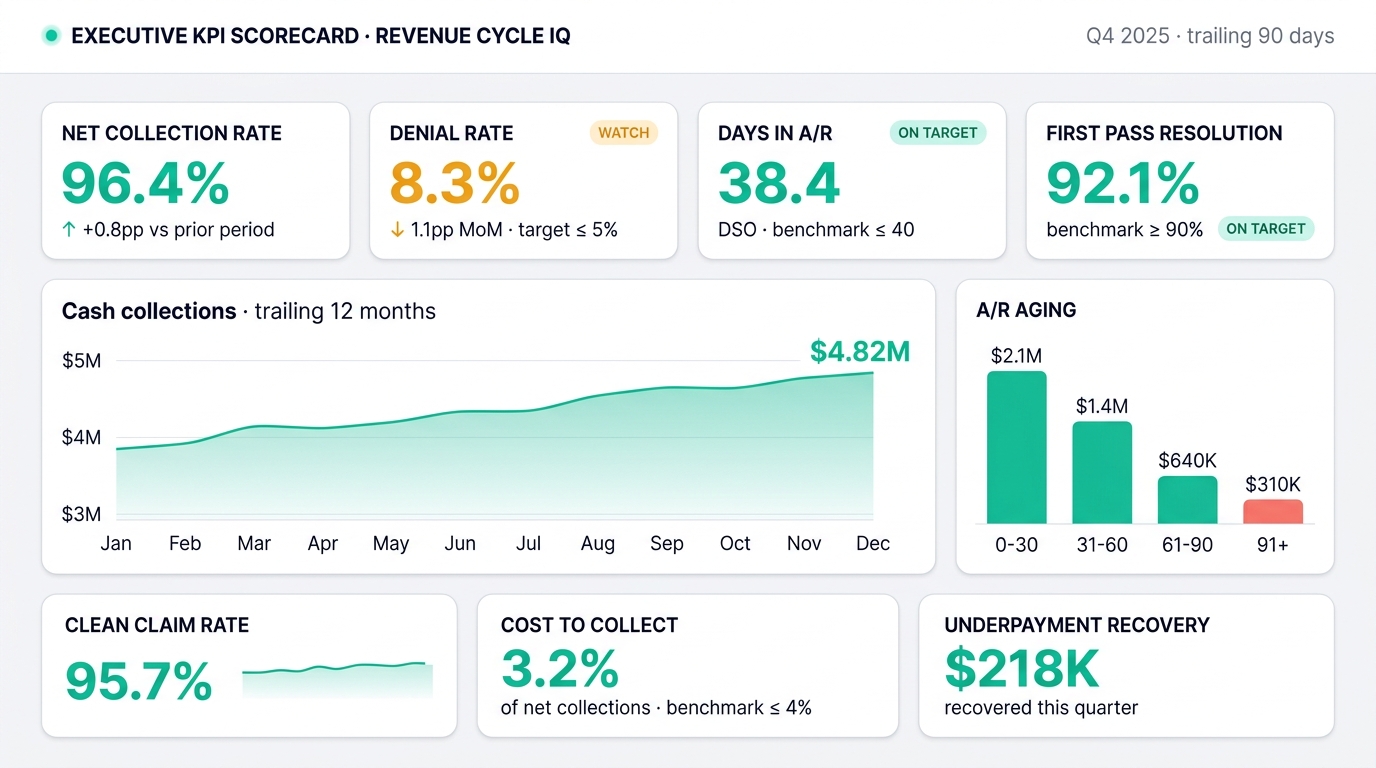
Most executive dashboards measure activity. A small set of outcome metrics tells you, every Monday morning, where to focus the week. Here is the layout that works.


- A useful CFO dashboard has fewer than ten metrics, not fifty.
- Outcome KPIs beat activity KPIs every time.
- Every metric should have a named operational owner.
Why Most Revenue Cycle Dashboards Miss the Mark
Healthcare organizations have access to more data than ever before, yet many executives still struggle to answer a simple question:
How is our revenue cycle performing today?
Many dashboards contain dozens of metrics, complex visualizations, and operational details that make it difficult for leadership teams to quickly identify financial risks and opportunities.
An effective executive dashboard should focus on a handful of key performance indicators that directly impact cash flow, revenue, and organizational performance.
The goal is simple: provide CFOs and executive leaders with a clear view of financial health, operational efficiency, and emerging risks.
The Purpose of an Executive Revenue Cycle Dashboard
A well-designed executive dashboard should answer five critical questions:
- Are we getting paid timely?
- Are claims being submitted cleanly?
- Are denials increasing?
- Is cash performance meeting expectations?
- Where are the biggest financial risks?
If leadership cannot answer these questions within a few minutes, the dashboard is likely too complex or focused on the wrong metrics.
KPI #1: Cash Collections
Why It Matters
Cash is the lifeblood of every healthcare organization. While charges and accounts receivable provide important context, cash collections ultimately determine financial performance.
What to Monitor
- Current month cash collections
- Year-to-date cash collections
- Actual vs. budget
- Actual vs. forecast
- Collection trends by month
Executive Insight
Declining cash collections often indicate larger issues within denials, claim submission, eligibility verification, or payor reimbursement.
KPI #2: Net Collection Rate
Why It Matters
Net Collection Rate measures how effectively an organization collects reimbursement that it is contractually entitled to receive.
Formula
Net Collection Rate = Payments ÷ (Charges − Contractual Adjustments) × 100
Executive Target
- Greater than 95% is considered strong performance
- Consistent declines warrant immediate investigation
Executive Insight
A declining Net Collection Rate may indicate underpayments, write-off issues, denial growth, or ineffective follow-up processes.
KPI #3: Denial Rate
Why It Matters
Denials represent delayed cash flow and increased operational costs.
Every denial requires staff time, rework, appeals, and additional follow-up.
What to Monitor
- Overall denial rate
- Top denial categories
- Top denial payors
- Denial trends over time
Executive Target
- Less than 10%
- Best-in-class organizations often operate below 5%
Executive Insight
The focus should not simply be on denial volume but on identifying root causes and preventing denials before claims are submitted.
KPI #4: Clean Claim Rate
Why It Matters
Clean Claim Rate measures the percentage of claims submitted without errors, omissions, or issues that would prevent processing.
Executive Target
- Greater than 95%
Executive Insight
A lower Clean Claim Rate often signals front-end workflow issues involving registration, eligibility, authorization, coding, or claim edits.
Organizations with high Clean Claim Rates typically experience fewer denials and faster reimbursement.
KPI #5: Days in Accounts Receivable
Why It Matters
Days in AR measures how long it takes to convert services into cash.
What to Monitor
- Total Days in AR
- Commercial Days in AR
- Government Days in AR
- Self-Pay Days in AR
Executive Target
- Generally less than 40 days, depending on specialty and payor mix
Executive Insight
Increasing Days in AR may indicate denial issues, payor delays, ineffective follow-up, or workflow bottlenecks.
KPI #6: Accounts Receivable Aging
Why It Matters
Aging reveals how much revenue is becoming increasingly difficult to collect.
Key Buckets
- 0–30 Days
- 31–60 Days
- 61–90 Days
- Over 90 Days
Executive Insight
Large balances sitting over 90 days often indicate unresolved denials, payment delays, or ineffective collection strategies.
Organizations should regularly evaluate the collectability of aging accounts rather than simply tracking balances.
KPI #7: Revenue Forecast
Why It Matters
Historical reporting explains what happened.
Revenue forecasting helps leadership understand what is likely to happen next.
What to Monitor
- Expected cash over the next 30, 60, and 90 days
- Open AR expected to convert to cash
- Pending denials
- Underpayment opportunities
- High-risk accounts
Executive Insight
Forecasting provides leadership with greater visibility into future cash performance and supports more informed operational and financial planning.
KPI #8: Top Financial Risks
Why It Matters
Executives need visibility into emerging issues before they become financial problems.
Examples
- Rising authorization denials
- Increasing AR over 90 days
- Payor reimbursement delays
- Underpayment trends
- Eligibility failures
- High-dollar unresolved claims
Executive Insight
A dashboard should not only report performance but also identify where leadership intervention may be needed.
What an Executive Dashboard Should Not Include
Many dashboards become cluttered with operational details that provide little executive value.
Avoid:
- Excessive claim-level detail
- Large spreadsheets of raw data
- Hundreds of KPIs
- Metrics without actionability
- Information that does not directly impact financial performance
Executives need clarity, not complexity.
Executive Takeaway
The most effective revenue cycle dashboards focus on a small number of high-impact metrics that provide immediate visibility into financial performance, operational efficiency, and revenue risk.
When designed correctly, an Executive Revenue Cycle Dashboard becomes more than a reporting tool—it becomes a strategic decision-making platform.
Organizations that effectively monitor cash collections, denials, net collection rate, AR performance, and revenue forecasts are better positioned to improve cash flow, reduce financial risk, and drive sustainable growth.
Questions Every CFO Should Be Able to Answer
- Are we collecting the revenue we are entitled to?
- Where are we losing revenue?
- What financial risks require attention today?
- What will cash performance look like over the next 90 days?
- Are our revenue cycle initiatives producing measurable results?
The answers to these questions should be available in a dashboard—not buried in a spreadsheet.
Stay Ahead of Revenue Cycle Trends
Subscribe to receive executive insights, industry trends, revenue cycle strategies, KPI guidance, denial management best practices, and AI innovations delivered directly to your inbox.
More in KPIs & Analytics
The Most Important KPIs Every Revenue Cycle Leader Should Monitor
You cannot improve what you do not measure. The 10 KPIs every revenue cycle leader should monitor — and the questions each one answers.
Clean Claim Rate vs. First Pass Resolution: Understanding the Difference
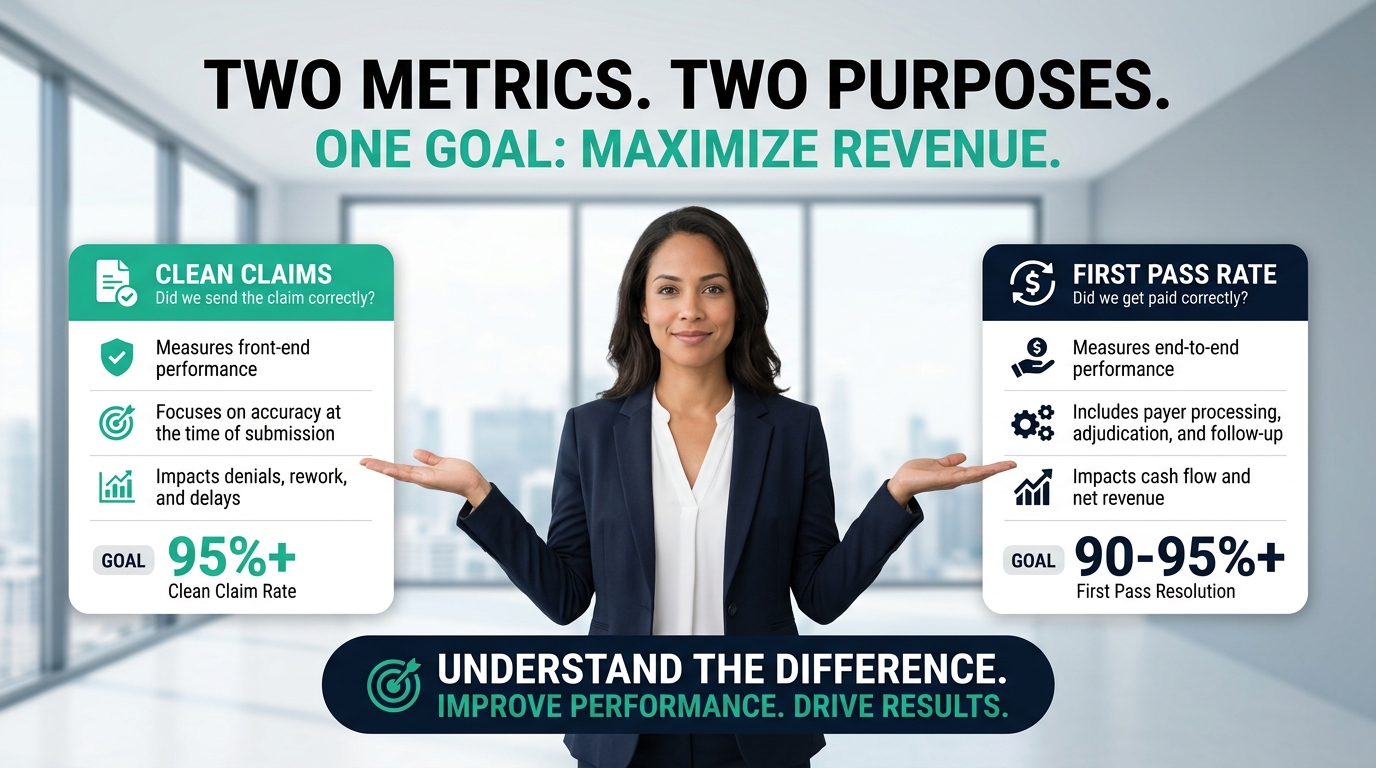
Two metrics. Two very different stories. Clean Claim Rate measures how claims leave the organization. First Pass Resolution measures how they get paid. Knowing the difference is essential for improving reimbursement.
Ready to Improve Revenue Cycle Performance?
Explore Revenue Cycle IQ's consulting services, analytics solutions, and executive intelligence tools designed to help healthcare organizations improve financial outcomes.