
The Most Important KPIs Every Revenue Cycle Leader Should Monitor
You cannot improve what you do not measure. The 10 KPIs every revenue cycle leader should monitor — and the questions each one answers.

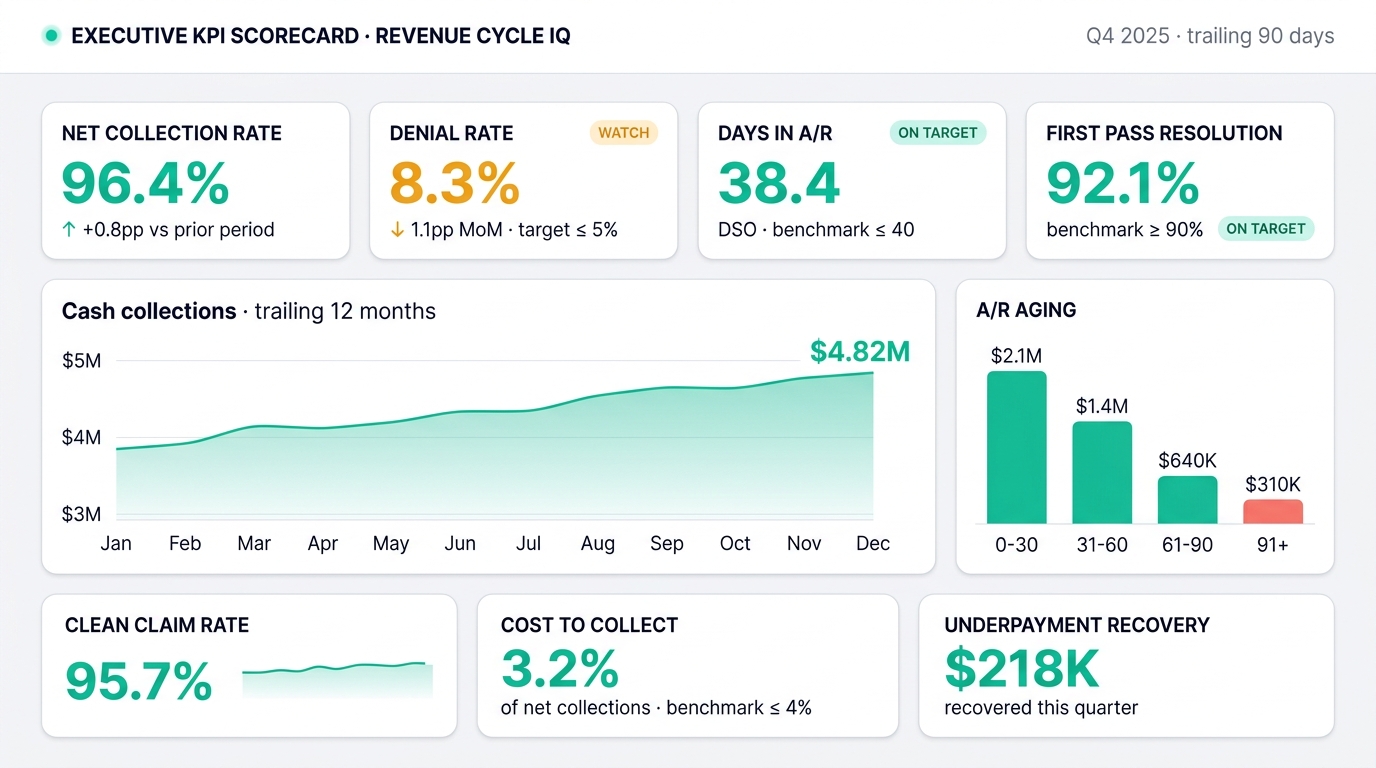
- Track outcomes, not activity.
- Segment every metric by payor.
- Tie each KPI to an owner and a weekly review cadence.
You Cannot Improve What You Do Not Measure
Revenue cycle leaders have access to an overwhelming amount of data.
Dashboards often contain hundreds of metrics, reports, and performance indicators, making it difficult to determine which measures truly matter.
The reality is that not every metric deserves executive attention.
High-performing revenue cycle organizations focus on a core set of Key Performance Indicators (KPIs) that provide visibility into financial performance, operational efficiency, reimbursement effectiveness, and revenue risk.
The goal is not to monitor more metrics. The goal is to monitor the right metrics.
Why KPIs Matter
KPIs provide leadership with early visibility into emerging challenges before they impact cash flow and financial performance.
The right metrics help organizations:
- Improve cash collections
- Reduce denials
- Accelerate reimbursement
- Identify revenue leakage
- Improve operational efficiency
- Strengthen financial forecasting
Without meaningful KPIs, leaders are often reacting to problems instead of preventing them.
KPI #1: Cash Collections
Why It Matters
Cash collections are the ultimate measure of revenue cycle performance. While charges, claims, and accounts receivable provide valuable operational insight, cash is what keeps organizations financially healthy.
What to Monitor
- Monthly cash collections
- Year-to-date cash collections
- Actual versus budget
- Actual versus forecast
- Collection trends
Executive Target
Collections should consistently meet or exceed forecast expectations.
What It Tells You
Declining cash collections often indicate upstream issues involving denials, claim submission delays, eligibility challenges, or payor reimbursement problems.
KPI #2: Clean Claim Rate
Why It Matters
Clean Claim Rate measures the percentage of claims submitted without errors or omissions. It is one of the strongest indicators of front-end revenue cycle performance.
Executive Target
- Greater than 95%
What It Tells You
A declining Clean Claim Rate often points to:
- Registration errors
- Eligibility issues
- Missing authorizations
- Coding inaccuracies
- Charge capture problems
Organizations with strong Clean Claim Rates typically experience fewer denials and faster reimbursement.
KPI #3: Denial Rate
Why It Matters
Denials create delayed cash flow, increased labor costs, and additional rework. Every denial represents revenue that was not paid as expected.
Executive Target
- Less than 10%
- Best-in-class organizations often operate below 5%
What It Tells You
A rising denial rate may indicate:
- Authorization issues
- Eligibility failures
- Documentation deficiencies
- Coding errors
- Workflow breakdowns
Denial prevention should be a priority for every revenue cycle team.
KPI #4: Net Collection Rate
Why It Matters
Net Collection Rate measures how effectively an organization collects the reimbursement it is contractually entitled to receive.
Executive Target
- Greater than 95%
What It Tells You
A declining Net Collection Rate may indicate:
- Underpayments
- Untimely follow-up
- Write-off issues
- Denial management challenges
- Revenue leakage
This KPI provides one of the clearest views of overall reimbursement effectiveness.
KPI #5: Days in Accounts Receivable
Why It Matters
Days in AR measures how efficiently services are converted into cash.
Executive Target
- Less than 40 days, depending on specialty and payor mix
What It Tells You
Increasing Days in AR often signals:
- Payor delays
- Denial issues
- Operational inefficiencies
- Inadequate follow-up
Days in AR is one of the most commonly monitored executive revenue cycle metrics.
KPI #6: A/R Over 90 Days
Why It Matters
A/R over 90 days often represents the most difficult balances to collect.
Executive Target
- Less than 20%
- Best-in-class organizations often achieve less than 10%
What It Tells You
High aging balances may indicate:
- Unresolved denials
- Delayed payor responses
- Poor follow-up processes
- Revenue cycle bottlenecks
A/R over 90 days should be viewed as a symptom of upstream issues rather than simply a collections problem.
KPI #7: First Pass Resolution Rate
Why It Matters
First Pass Resolution measures the percentage of claims paid without additional corrections, appeals, or follow-up.
Executive Target
- Greater than 90%
What It Tells You
A low First Pass Resolution rate often indicates:
- Denials
- Documentation issues
- Authorization challenges
- Payor processing problems
This metric helps organizations evaluate overall claim payment effectiveness.
KPI #8: Charge Lag
Why It Matters
Charge Lag measures the time between the date of service and charge entry.
Executive Target
- 5–7 days or less
What It Tells You
Long charge lag delays reimbursement and directly impacts cash flow.
Even strong denial management processes cannot overcome claims that have not been submitted.
KPI #9: Revenue Forecast Accuracy
Why It Matters
Forecasting accuracy measures how closely projected cash collections align with actual results.
Executive Target
- Within 5% of actual performance
What It Tells You
Strong forecasting provides leadership with greater confidence in financial planning and resource allocation.
Organizations with poor forecasting often struggle to anticipate financial challenges.
KPI #10: Revenue at Risk
Why It Matters
Revenue at Risk identifies balances that may never convert to cash without intervention.
Examples include:
- High-dollar denials
- Underpayments
- Timely filing risks
- Aging accounts
- Appeals nearing deadlines
What It Tells You
This KPI provides visibility into potential financial exposure before revenue is lost.
Building an Executive KPI Dashboard
The most effective dashboards focus on a concise set of meaningful metrics.
At a minimum, every executive dashboard should include:
✔ Cash Collections
✔ Clean Claim Rate
✔ Denial Rate
✔ Net Collection Rate
✔ Days in AR
✔ A/R Over 90 Days
✔ First Pass Resolution
✔ Charge Lag
✔ Forecast Accuracy
✔ Revenue at Risk
The goal is to provide leadership with actionable insights rather than overwhelming amounts of data.
Executive Takeaway
The most successful revenue cycle organizations are not necessarily the ones with the most reports.
They are the organizations that consistently monitor the right KPIs, identify emerging risks early, and take action before financial performance is impacted.
A well-designed KPI strategy provides leadership with the visibility needed to improve cash flow, reduce denials, strengthen reimbursement, and drive long-term financial success.
Questions Every Revenue Cycle Leader Should Be Asking
- Which KPIs have the greatest impact on cash flow?
- Are we monitoring leading indicators or lagging indicators?
- Where are we losing revenue?
- Which metrics require executive intervention?
- Are our improvement initiatives producing measurable results?
The answers to these questions often determine whether a revenue cycle team remains reactive or becomes truly strategic.
Stay Ahead of Revenue Cycle Trends
Subscribe to receive executive insights, industry trends, revenue cycle strategies, KPI guidance, denial management best practices, and AI innovations delivered directly to your inbox.
More in KPIs & Analytics
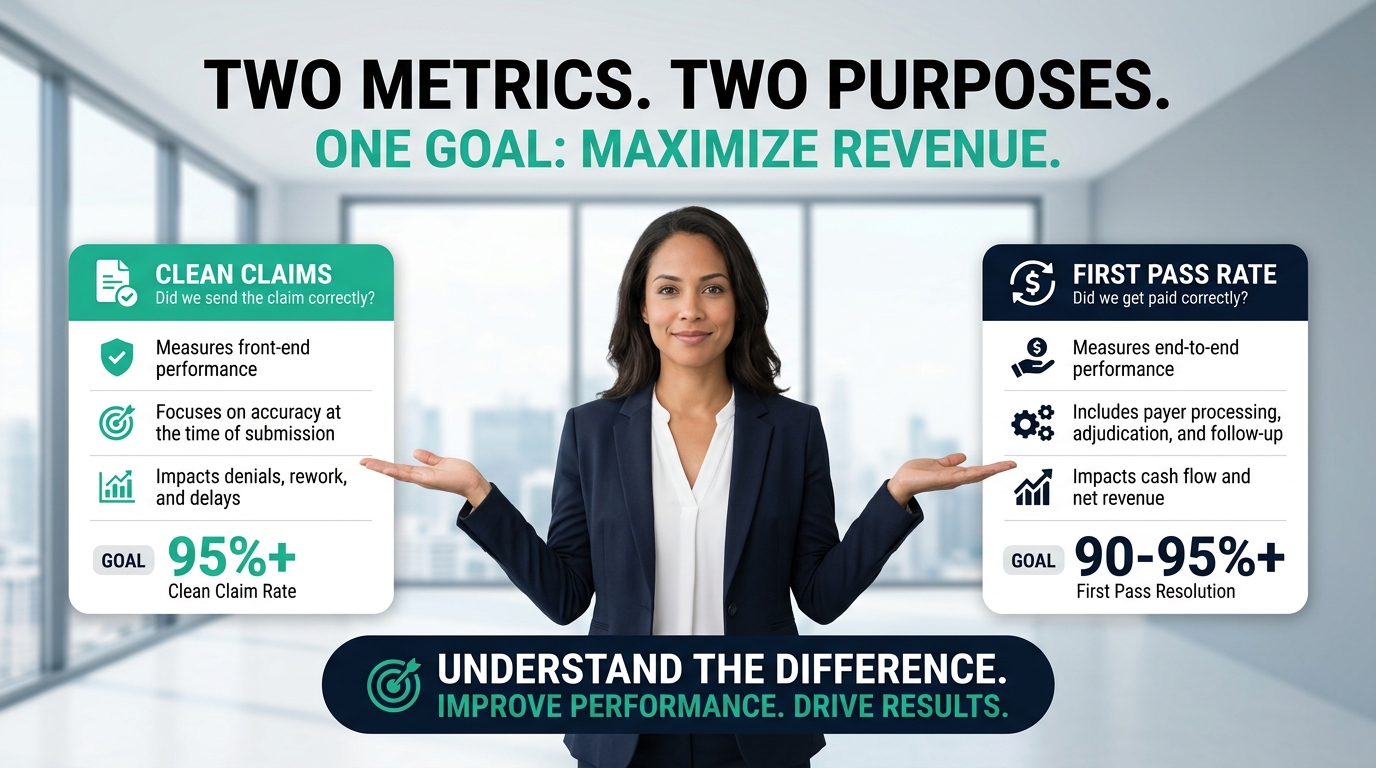
Clean Claim Rate vs. First Pass Resolution: Understanding the Difference
Two metrics. Two very different stories. Clean Claim Rate measures how claims leave the organization. First Pass Resolution measures how they get paid. Knowing the difference is essential for improving reimbursement.

The Executive Revenue Cycle Dashboard Every CFO Needs
Most executive dashboards measure activity. A small set of outcome metrics tells you, every Monday morning, where to focus the week. Here is the layout that works.
Ready to Improve Revenue Cycle Performance?
Explore Revenue Cycle IQ's consulting services, analytics solutions, and executive intelligence tools designed to help healthcare organizations improve financial outcomes.